Auditing Sites
When you audit a Site on demand,
To audit a Site, follow these steps:
- Right-click the Site in the Sidebar and select Audit This Site from the pop-up menu or press F9.
- If the Site has more than one Audit Sources, the Select Audit Sources dialog box opens. Select the sources to audit and click OK.
- A new "Audit" task appears in the Task List. When the task is finished, the Site will be populated with audited computers, Chromebooks, and network devices.
NOTE: After audit snapshot is uploaded to the database, the
Changesmessage appears in the status bar. Click this message to refresh the data display.
When new Network Nodes are added to the network, instead of running the audit of an entire Site you can audit only those nodes that were not audited yet.
To audit previously unaudited nodes:
- Right-click the Site in the Sidebar and select Audit This Site > Audit Never Audited from the pop-up menu.
- If the Site has more than one Audit Sources, the Select Audit Sources dialog box opens. Select the sources to audit and click OK. A new "Audit" task appears in the Task List. When the task is finished, the Site will be populated with newly audited computers, Chromebooks or network devices.
NOTE: After audit snapshot is uploaded to the database, the
Changesmessage appears in the status bar. Click this message to refresh displayed data in grids.
All Nodes Grid
After auditing a Site, the All Nodes grid displays audit results for computers, Chromebooks and network devices. Audited network nodes are displayed as colored icons in the grid.
To view the details of a Network Node, double-click its record. If you have created user-defined fields for a particular object class (All Nodes, Computers, Chromebooks or Network Devices), the dialog box will include the Custom Data tab, where you can enter any additional information about the node.
INFO: For more information, see Viewing record details and Viewing record details.
NOTE: You can audit Chromebooks using the Google Directory Audit method only. For details, see Overview of Audit Methods.
Computers Grid
The Computers grid displays audit results for Computers.
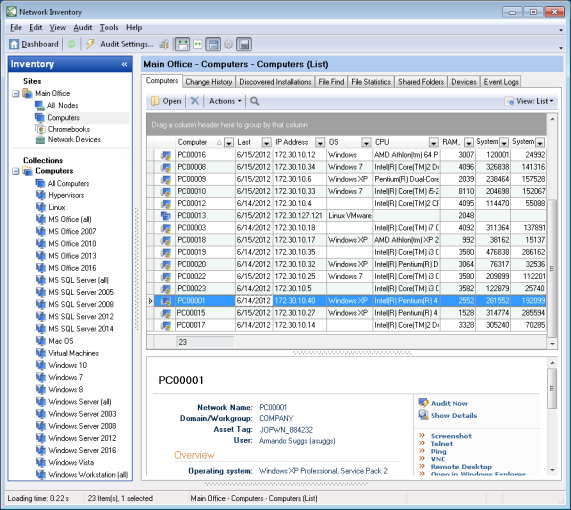
NOTE: You can open the Computers grid for a Site or for a Collection to view audited computers within the Site or Collection, respectively.
The Computers grid has the following tabs:
- Computers — lists computers in the current Site or Collection. It displays their key parameters, such as CPU type and speed, memory size, operating system details, etc.
- Change History — shows changes in the Site’s audit data during the specified period of time.
INFO: For details, see Viewing the Change History.
- Discovered Installations — displays software installations discovered on the computers within the Site.
NOTE: To specify how to discover software installations on client computers, you must configure Software Discovery options in the Site’s audit source. For details, see Audit Profile Options.
- File Find — allows you to search through the file scan data of audited computers in a Site.
NOTE: To enable the File Find option, you must configure File Scan in the Audit Profile. The results will be searchable only after auditing at least one Computer with the Detailed Scan option applied for at least one file mask. For details, see Configuring Audit Profiles.
- File Statistics — shows file statistics of the audited computers in a Site collected during the file scan.
NOTE: To enable
- Shared Folders — lists all shared folders found on the computers within the Site.
- Devices — displays devices installed on the computers within the Site.
- Event Logs — displays event log entries collected on the client computers.
NOTE: To enable
To view the details of a Computer, double-click its record, and the Computer [Computer Name] dialog box opens. If you have created user-defined fields for Computers, the Computer [Computer Name] dialog box will include the Custom Data tab, where you may enter any additional information about the computer.
INFO: For more information, see Viewing record details.
Chromebooks Grid
The Chromebooks grid displays audit results for Chromebooks.
The Chromebooks grid has the following tabs:
- Chromebooks — lists Chromebooks in the current Site or Collection. It displays their key parameters, such status, enrollment date, last sync, user, location, etc.
- Change History — shows changes in the Site’s audit data during the specified period of time.
INFO: For details, see Viewing the Change History.
To view the details of a Chromebook, double-click its record, and the Chromebook [Chromebook Name] dialog box opens. If you have created user-defined fields for Chromebooks, the Chromebook [Chromebook Name] dialog box will include the Custom Data tab, where you may enter any additional information about the Chromebook.
INFO: For more information, see Viewing record details.
Network Devices Grid
The Network Devices grid displays audit results for Network Devices.
To view the details of a network device, double-click its record, and the Network Device [Device Name] dialog box opens.
NOTE: You can also configure custom network device types that will also be displayed in the grid.
If you have created user-defined fields for Network Devices, the Network Device [Device Name] dialog box will also include the Custom Data tab, where you may enter any additional information about the device.
INFO: For more information, see Viewing record details.