Project - Tasks tab - Gantt chart
Updated in 2025
The Gantt chart is a graphical representation of project tasks across a timeline. You can use the chart to schedule tasks and assess the progress of the overall project.
Overview
On the left side of the Gantt chart, all tasks are arranged in a grid with the following columns:
-
Name: The name of the task. The task name aggregates the ID and the summary of the Task. For details, see General tab.
-
Assignee: The name of the person assigned to complete the task.
-
Start: The planned start date of the task. This field also displays whether the task is on time, late or ahead by comparing planned start time against real start time.
-
Finish: The planned end date of the task. This field also displays whether the Task is on time, late or ahead by comparing planned end time against real end time.
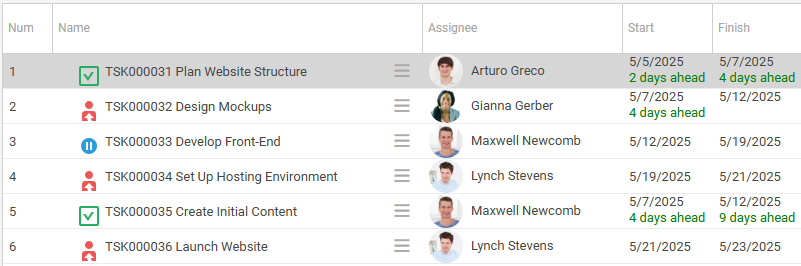
All tasks are organized in the hierarchical tree, revealing the breakdown structure of the work to be done on a project. Using the grid, you can create new tasks, manage tasks hierarchy, customize tasks and perform other workflow actions available.
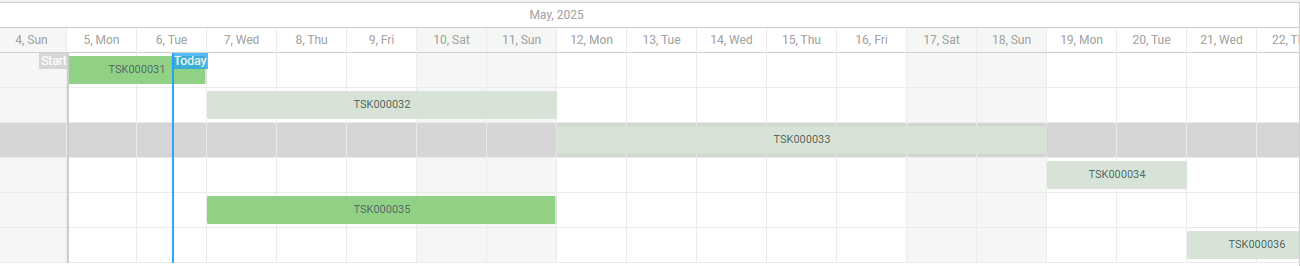
On the right side of the Gantt chart, you can see the illustration of your project tasks in colored bars. The bars show the duration of your tasks against the progression of time. For each task, the associated bar begins at the start date and ends at the finish date. The Gantt chart also shows special tasks, called milestones. A milestone is used to indicate any critical point of the project. All milestones are shown with the diamond icons ![]() . With the task bar, you can schedule tasks and monitor their progression states.
. With the task bar, you can schedule tasks and monitor their progression states.
Color coding
The color of the bar is based on the task state and the percent complete.
| Color | Explanation |
|---|---|
|
Light green
bar |
The task is pending or open and has 0% completion. |
|
Bright green bar |
The task is in progress or completed, with 1–100% completion. The bright green portion indicates how much of the task is complete. |
|
Light red bar |
The task is unscheduled (missing planned dates). |
|
Bright red bar |
The task is unscheduled but has 1–100% completion. The bright red portion indicates the percentage completed. The task may be in the In Progress or Completed state. |


TIP: If a task bar appears in red, it may indicate scheduling inconsistencies. Review the task’s dates and the overall project schedule to resolve potential issues.
To open detailed information about any project task directly from the Tasks grid:
-
In the Tasks grid, double-click a record. The referenced object will open in a fly-out preview form.
-
To access its full form, click a circle edit icon.
-
Make changes and click Save on the Module menu.
Creating tasks and performing workflow actions
The Gantt chart enables you to create new tasks within the project and perform workflow actions on existing ones.
To create a new task or a milestone:
-
On the grid Module menu, click New > Task / Milestone.
-
Enter task details.
-
Click Submit.
To perform a workflow action on a task:
-
In the Tasks grid, right-click a task record and choose a workflow action from the pop-up menu.
NOTE: Workflow actions are not available for closed tasks.
TIP: If you want the Gantt chart to display the latest changes, click the Refresh button on the task bar module menu.
Adjusting the chart view
To adjust the time period shown on the Gantt chart:
-
On the task bar module menu, use the Zoom in / Zoom out buttons to change the time frame in the required area. You can view the chart information by hours, days, weeks, months, quarters, or by years.
-
If you want to show only the current date, click the Today button.
-
If you want to show a specific date, click the Custom Date button and choose a date from the pop-up calendar.
Controls and functions
-
New: Creates a task or a milestone.
-
lndent: Moves the selected tasks together with their subordinate tasks in the tree and makes these tasks subordinate to above task. For details, see Creating hierarchy of Tasks.
-
Outdent: Moves the selected tasks together with their subordinate tasks to the upper- level on the hierarchical tree. This action is available only for subordinate tasks. For details, see Creating hierarchy of Tasks.
TIP: You can use drag and drop operations to manage task hierarchy as needed.
-
Expand/Collapse All: Expands or collapses all tasks in a grid.
Sub-Task: Allows you to create sub-tasks for the selected tasks. For details, see Creating hierarchy of Tasks.
Assign to me: Allows you to assign the task to yourself. For details, see Assigning Tasks to technicians.
Assign to: Allows you to assign the Task to any technician. For details, see Assigning Tasks to technicians.
Plan Task: Allows you to review and plan the task dates. For details, see Planning Tasks.
Place On Hold / Take Off Hold: Allows you to place your task on hold or take your task off hold. For details, see Placing Tasks on hold and taking Tasks off hold.
Complete Task: Allows you to complete the task.
Notify Assignee: Allows you to send an e-mail to the task's assignee about any task activity. For details, see Notifying Project managers and Task assignees.
Notify Project Manager: Allows you to send an e-mail to the Project Manager. For details, see Notifying Project managers and Task assignees
Add Comment: Allows you to add additional information about your task.
Automatic Timer On / Automatic Timer Off: Allows you to turn on or turn off the timer for tracking your work. For details, see Using Automatic Timers of Tasks.
Create Sub-Task: Allows you to create sub-tasks for the selected tasks. For details, see Sub-Tasks tab and Creating hierarchy of Tasks.
Mark as Duplicate: Allows you to mark a task as duplicate.
Copy Task: Allows you to copy any task.
-
Custom Date: Enables you to display the task bar for the specific date.
-
Today: Shows the task bar for the current date.
-
Zoom In: Changes the time frame by zooming in the required area. You can view the chart information by hours, days, weeks, months, quarters, or by years.
-
Zoom Out: Changes the time frame by zooming out the required area. You can view the chart information by hours, days, weeks, months, quarters, or by years.
-
Fit: Fits the view to the selected task.
-
Refresh: Refreshes the chart.
-
Schedule: Enables you to schedule the Task. For details, see Scheduling Tasks.
Actions menu of the Gantt chart enables you to perform workflow actions with the project. For details, see Working with Projects and Tasks.