Dashboard
The dashboard is the landing page for AlloyScan. It provides an overview of network health and key statistics for your organization, including segments, audit services, and discovered and audited devices. From here, you can also download audit agents for different operating systems.
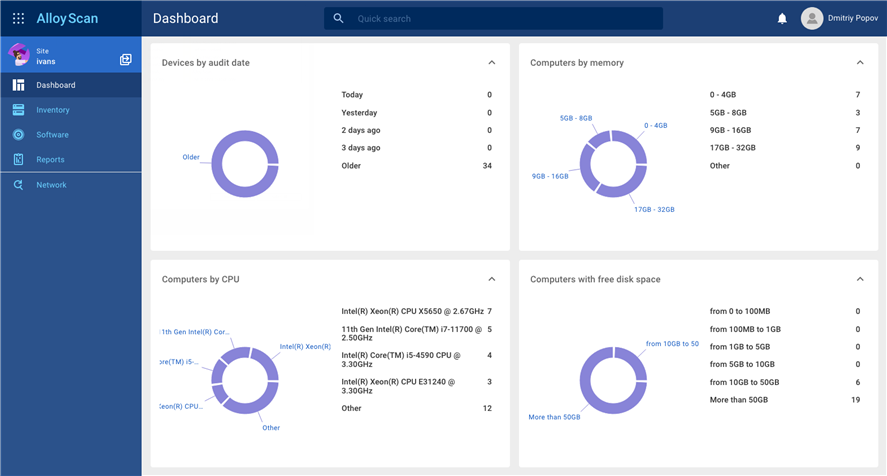
The dashboard is made up of widgets—visual representations of your audit data, presented in charts and tables filtered by various parameters. All charts are interactive: clicking on a chart element or data row drills down to the detailed list of devices it represents. Charts are updated automatically as new audit results become available.
The dashboard is preconfigured. At this time, widgets cannot be added, removed, or rearranged. You can collapse or expand widgets to focus on the information most relevant.