Customizing data views
This article explains how to customize data views in AlloyScan to display exactly what you want to see.
A data view is a visual representation of structured data in a tabular format, such as a list of devices in the Inventory section or a list of user accounts in the Admin Center's Users section. Each row in a data view represents a single record, such as an audited device or user account, with specific details displayed across columns. Typically, data views show only a limited set of columns by default, while others remain hidden. You have control over how much details your data views display. Once a data view shows what you need, you can sort and filter the displayed information for quick and efficient data analysis.
Organizing columns
In a data view, each column represents a specific record field. You can show and hide columns and change their display order. Please note that adding too many columns may clutter your interface.
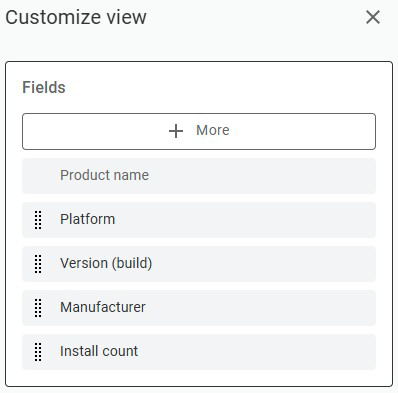
To start organizing columns, click ![]() Customize view in top-right corner of the data view. This action opens the Customize view dialog box.
Customize view in top-right corner of the data view. This action opens the Customize view dialog box.
Adding columns
If the field you want to include is not visible in the initial list, click the + More button and choose the required field from the list.
Changing column order
You also have the ability to change the display order of the columns in the data view. To rearrange the columns, click anywhere inside the field that represents the column you want to move and drag it to the desired position in the column order.
Removing columns
To remove a field from the display:
-
Locate the field you want to remove in the list of selected columns.
-
Click on the three vertical dots icon associated with that particular field. A menu with additional options is displayed.
-
Select Remove.
NOTE: The top item in the list is a system column. It cannot be rearranged, but you can use its check box to show or hide it in the data view.
Data views for hierarchical structures, like device groups in the Inventory section, have the Apply to all subgroups check box in this dialog box. Keep the check box selected to immediately apply your view customizations to all existing subgroups.
Click Save to apply and save your changes.
Grouping and sorting
See how you can group and sort records in a data view.
Grouping |
|

|
AlloyScan supports grouping records in a data view to help you organize and analyze information more effectively. To group records, open Customize view, go to the Columns tab, and drag a field into the Group By area. The data view will automatically group records based on the selected field. You can collapse or expand groups to focus on specific subsets of data. You can also add multiple fields to create nested groupings. You can also group directly from the data view. Right-click inside a column, then select Group > GroupBy. The selected column is added automatically to the Group By area in the Columns tab. To remove grouping, in the Group By area, click the x next to it, and then click Apply or Save. For detailed information about grouping behavior and additional options, see Alloy Navigator Help: Grouping. |
Sorting |
|
|---|---|
|
|
To sort records in a data view, click on the header of a column you want to sort by and observe the arrow that appears. The up arrow indicates ascending sort order, while the down arrow indicates descending order. To change the sorting order, click the column header again. You can only sort a data view by one column at a time. In the screenshot on the left, the records are sorted by platform, in descending alphabetical order. |

Filtering records
See how you can filter records in a data view.
Filtering |
|
|
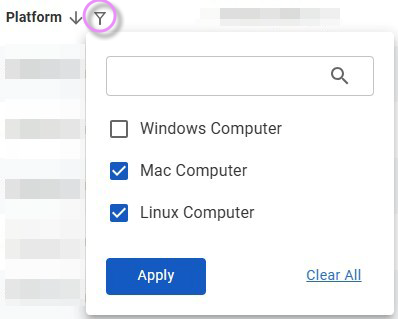
To filter records by a column, click the filter icon in the column header. This will display a list of all unique column values in the data view. Then, select the values by which you want to filter the records. You can filter a data view by multiple values of multiple columns. Filtered columns receive a colorful filter icon in their header. In the screenshot on the left, the records are filtered by platform, with the Windows platform filtered out. You can also filter directly from the data view by right-clicking a cell and selecting Filter > FilterBy. This filters the data view by the value in the selected cell for that column. To exclude that value, right-click the cell and select Filter > FilterNotBy. In addition, you can use the Filter items field in the top-right corner of the page (shortcut: Ctrl+F). It filters the data view based on the text you enter. |
Conditional formatting
AlloyScan supports conditional formatting in data views, allowing you to apply visual styles (such as color highlighting or icons) to rows or cells based on rules you define. You can set conditions using field values, comparison operators, and specific criteria to draw attention to important records (for example, overdue items or critical statuses).
Conditional formatting rules can be added and managed from the Conditional formatting tab in the Customize view dialog. Once applied, they help you quickly identify records that meet the conditions you’ve specified.
For details on how conditional formatting works and examples of rule configuration, Alloy Navigator Help: Conditional formatting
Saving and applying changes
After customizing a data view, you can decide whether to apply or save your changes.
-
Click Apply to apply the changes temporarily without saving them.
-
Click Save to overwrite the current view with your changes.
-
Click Reset to discard unsaved changes and restore the view to its last saved state.
These options allow you to experiment with different configurations while keeping control over your saved data views.