Administrative Dashboard
This chapter explains how to work with the Administrative Dashboard of Alloy Navigator. This dashboard is available in the General > Administrative Dashboard section of the Settings Sidebar.
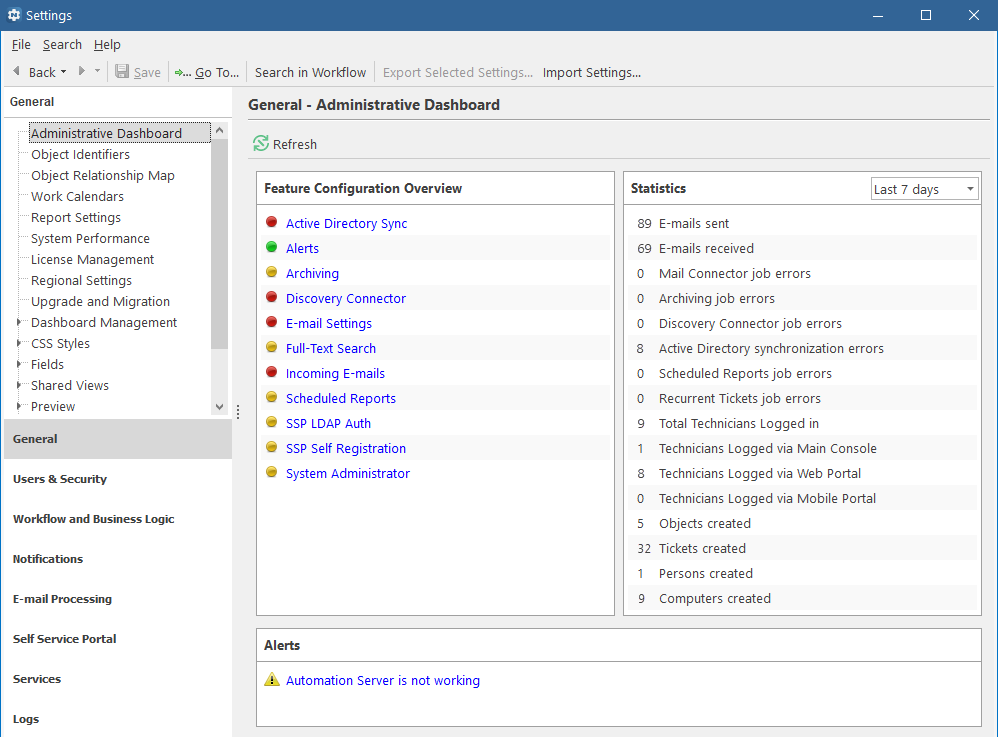
The Administrative Dashboard is the front page of your Settings. This pre-configured dashboard gives up-to-date information about events requiring administrator's attention (see figure below).
The Administrative Dashboard includes the following informative panels:
- Feature Configuration Overview - This panel displays a list of detected feature configurations that require administrator's handling and provides one-click access to feature configuration modules.
- Statistics - This panel stores latest statistics for configuration change events. By default, changes are shown for the current date.
- Alerts - This panel highlights alert notifications about errors and failures reported by Alloy Navigator system components. For example:
-
Last run of 2 job has failed
-
Number of days you have not performed a backup of the database
-
Enabled log may slow you down
-
Self-registering SSP users waiting approve
-
License will expire in 30 days
-
The number connected at the moment of concurrent users has reached the limit
-
Notification Queue has 5 failed notifications
-
The number of audited computers have reached the limits of the license
-
Automation Server is not working
-
There are pending Conflicts in AD Integration
-
Notification Queue is paused
-
Less than 20% of free space on the disk where the database is located